Reporting & dashboards
One source of truth for your whole business.
We pull the data out of every system you run and bring it into one place, so you can see how the business is really going and analyse it without exporting a single spreadsheet.
Single source of truth
Every system in. One live view out.- Job & project systems
- Accounts & payroll
- CRM & enquiries
- Safety & compliance
- Spreadsheets & inboxes
One live dashboard
Updated automatically, every day
- Project and job health at a glance
- Cash, debtors and margin by job
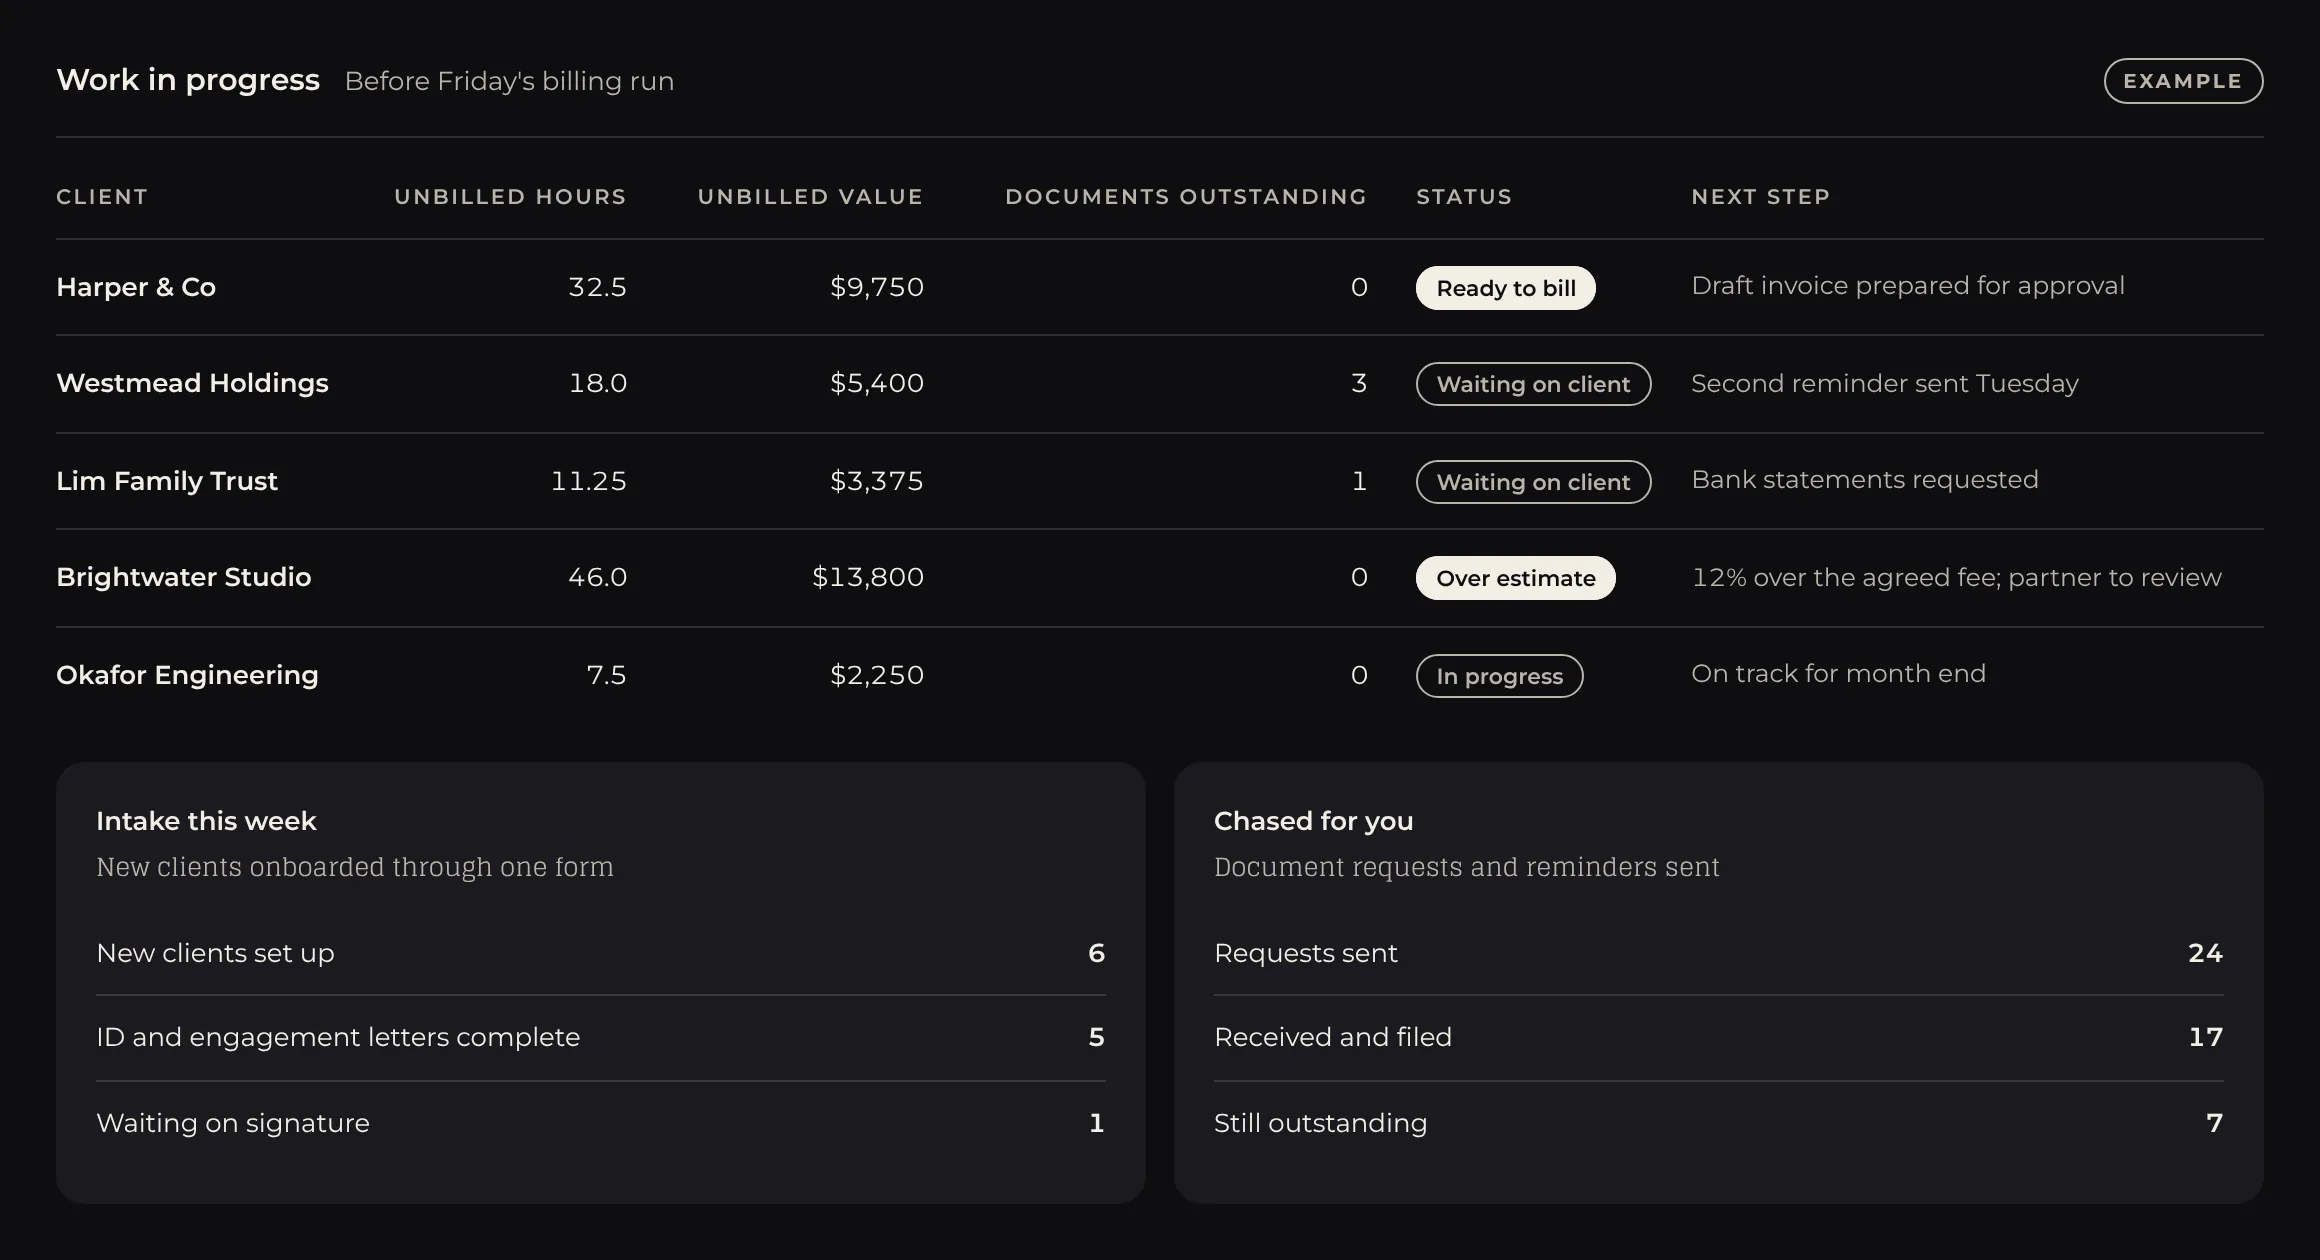
- Admin handled; exceptions to a person
- Weekly reports sent on schedule
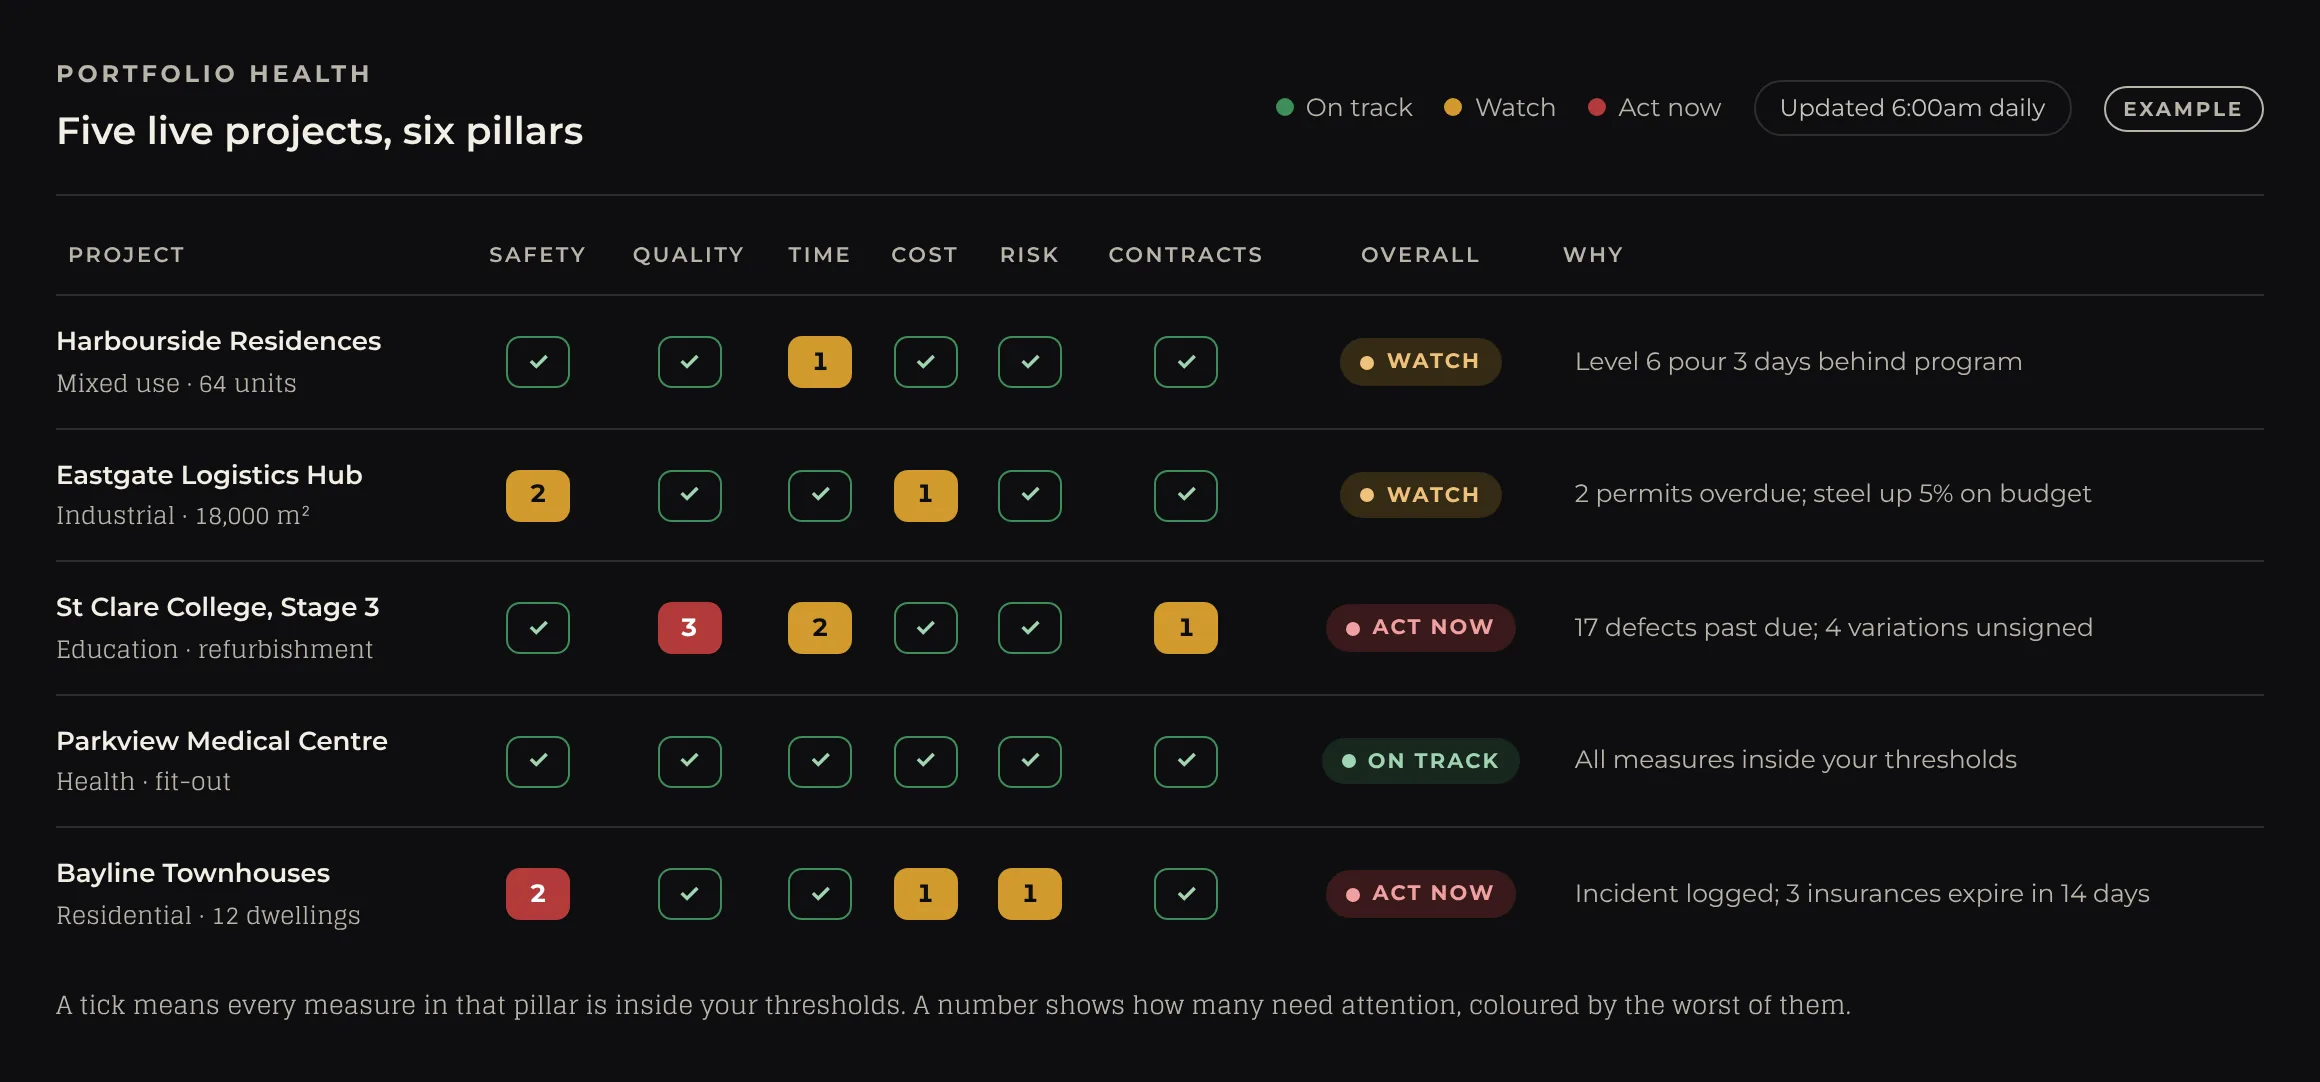
What your one source of truth looks like.
Every colour has a reason behind it, every number traces back to the system it came from, and trends show where things are heading.
- A reason behind every colourGreen, amber or red, with the line that explains it.
- Traceable numbersEvery figure links back to the system and record it came from.
- Leading and laggingSee what's about to go wrong, not just what already did.
- Your thresholdsYou decide what counts as amber or red.
By industry
See the view built for your business.
Cash and KPIs
Know which way the business is heading.
Trades and field service · KPI tiles with 8-week trend
Cash · debtors ageing
$276k owed, $9k past 90 days
Reminders go out automatically at 7, 14 and 30 days. Anything past 60 days is flagged to a person.
Getting paid
Debtors that chase themselves.
Every invoice is tracked from the day it's sent. Polite reminders go out on schedule, and only the accounts that need a phone call land on someone's desk.
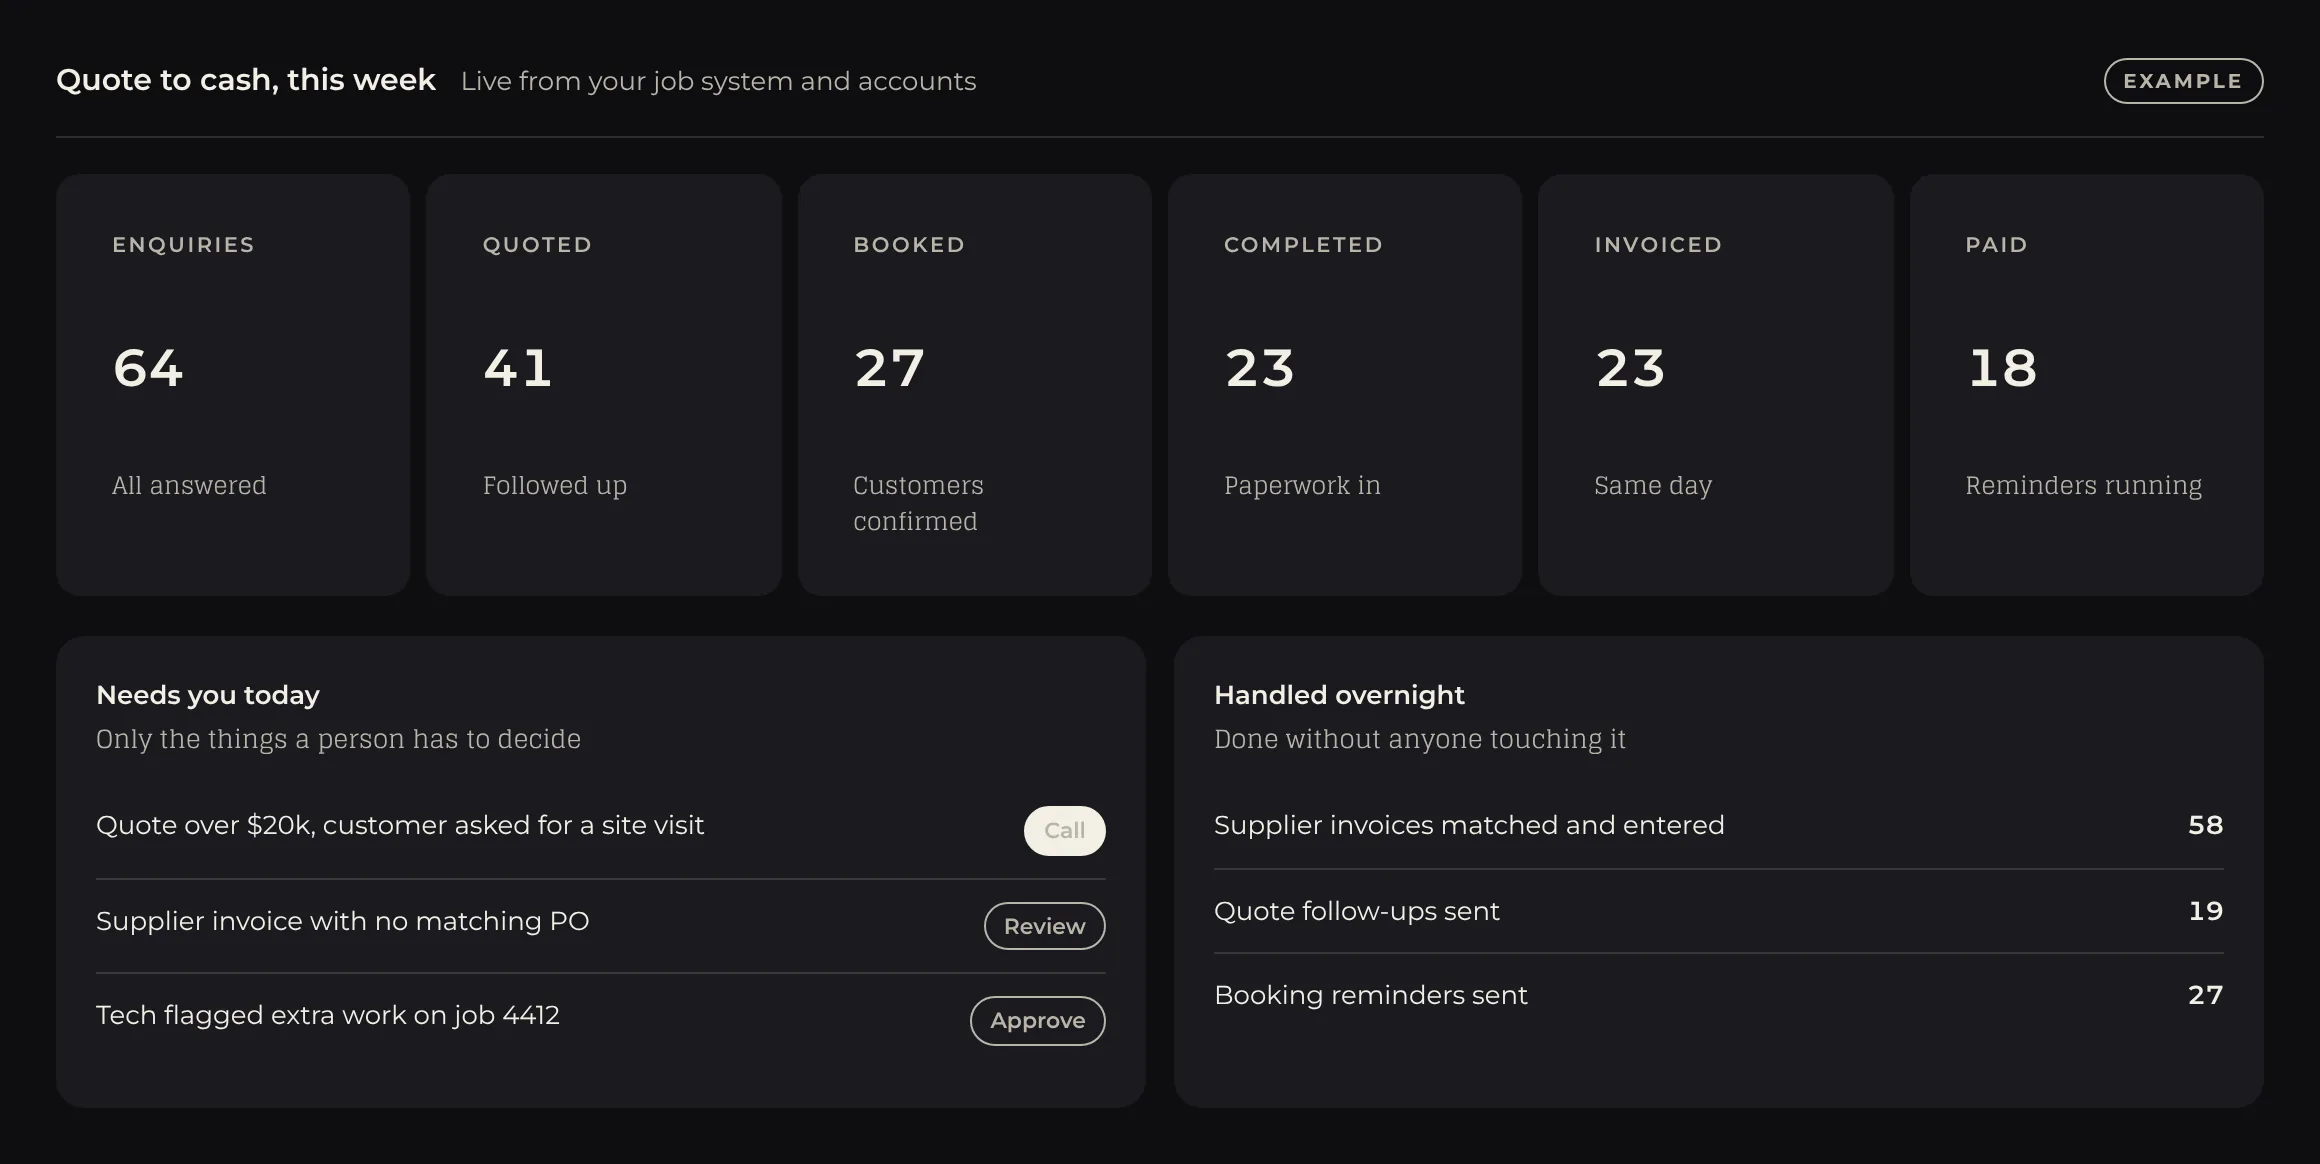
Cash, debtors and margin by job sit on the same screen as your quotes and bookings, so you see the whole week in one place.
Illustrative example data. Every dashboard is built on your own systems and your own thresholds.
Talk to the people who build it.
A 30-minute call with our team in Sydney. Tell us what's eating your week, and we'll tell you honestly whether we can fix it.